
Article page checkbox is not checked in page info.
Impact of Brexit on EU fishing quotas
Impact of Brexit on EU fishing quotas
Frederik Scholaert, Members' Research Service
Summary
The withdrawal of the United Kingdom (UK) from the EU has had a profound impact on fisheries relations in the North-East Atlantic. One of the most significant changes is the gradual transfer of EU fishing rights to the UK. This transfer is outlined in the EU-UK Trade and Cooperation Agreement, which spanned the five years from 2021 to 2025, and is considered to represent 25 % of the value of the former EU27 landings from UK waters.
We compare the fishing opportunities available to the EU in 2025 and 2026 — the first two years in which the transfer of fishing quotas was fully completed — with the theoretical quotas that would apply if the transfer of quotas had not taken place. In terms of volume, the pelagic species of herring and mackerel are most affected. In terms of value, demersal species, such as sole and Norway lobster, account for significant EU losses. As each Member State has a specific share of each stock, the loss of quota affects them to varying degrees. The transfer affects 13 Member States, but just seven bear almost the entire burden. A special case is north-east Atlantic mackerel, which is shared with several third countries. Since Brexit, the EU is no longer part of a quota-sharing agreement for this species. The sum of the fishing quotas set by all parties exceeds the scientifically recommended level, which is causing the stock to decline.
Introduction
The UK's withdrawal from the EU was a turning point in the history of fisheries relations in the North-East Atlantic. Many fish stocks that were previously exclusive EU resources have become shared resources under international law since 2021. Furthermore, six key North Sea stocks – cod, haddock, saithe, whiting, plaice and herring – which were previously managed bilaterally between the EU and Norway, are now subject to a trilateral agreement. The UK is also an independent actor in the fisheries for some widely distributed pelagic fish stocks, which involve several other third countries (including northern states such as the Faroe Islands and Iceland). This is notably the case for mackerel.
Under the United Nations Convention on the Law of the Sea (UNCLOS), coastal states have a responsibility to cooperate on the management of shared stocks. The Trade and Cooperation Agreement (TCA), agreed at the end of 2020, established the new EU–UK relationship. The fisheries agreement is set out in Heading Five of Part Two of the TCA. As part of the agreement, the EU transferred some of its quota shares to the UK, considered to represent 25 % of the value of former EU27 catches in UK waters. This transfer was gradual, taking place over five years.
Fishing quotas in the EU-UK Trade and Cooperation Agreement
The Trade and Cooperation Agreement (TCA) sets out the allocation of quotas between the EU and the UK for 87 shared fish stocks. These stocks are shared by the EU either bilaterally (with the UK), trilaterally (with the UK and Norway), or multilaterally (with the UK, Norway and other coastal states). Annexes 35 and 36 to the TCA set out the EU and UK quota shares for each of these stocks. The shares listed only reflect the mutual quota balance between the EU and the UK. The possible share of other third parties is not shown, as it is not within the scope of the TCA.
Concretely, both annexes outline a reduced EU quota share for 55 of those 87 fish stocks. The respective quota shares prior to Brexit (in 2020 or earlier) are not shown in the TCA annexes. Most of the quota transfer occurred in 2021 (60 % of the total transfer), with the remainder phased in over the following years until reaching 100 % in 2025. The '2026 onwards' column in these annexes indicates that, once the transfer is complete, the quota shares remain stable at the 2025 level. Neither party can change them without the other's consent. This is in line with the EU's 'relative stability' principle, under which a country receives the same share of the total catch limit each year (see box).
Allocation of EU fishing quotas and the principle of relative stability
For stocks managed by the EU, the EU determines the total allowable catch (TAC) – the maximum amount that can be fished each year. The TAC is then distributed among the Member States as quotas, according to the relative stability method. Under this method, a Member State receives the same percentage of a stock's TAC every year. These shares are referred to as relative stability keys.
A similar approach is taken for fish stocks that are now shared with the UK. Once the EU and the UK have agreed on the TAC for a given stock, the allocation between the two parties is based on the quota shares set out in the TCA. Regarding the internal distribution of the EU's share, the relative proportions between Member States remain essentially unchanged. This means that the reduction in the EU quota share is applied proportionally to the existing quota shares of the Member States. An important exception is the application of the 'Hague preferences' (see 'Hague preferences' under 'Methodology').
Impact of Brexit on the EU's fishing quotas
The results below show the impact of Brexit for 2025 and 2026, the first two years in which the full effects of the EU's quota reduction is felt. However, the results differ for each year as they also depend on the annual catch limits for the affected fish stocks. Indeed, the TACs are decided in December for the following year, and vary year-on-year, depending on the stock's biological status. This, in turn, affects the scale of the losses resulting from Brexit. For example, a reduced EU share of a smaller TAC demonstrates a lower Brexit impact than an equivalent share of an increased TAC. For more information on the calculation method used, see 'Methodology'.
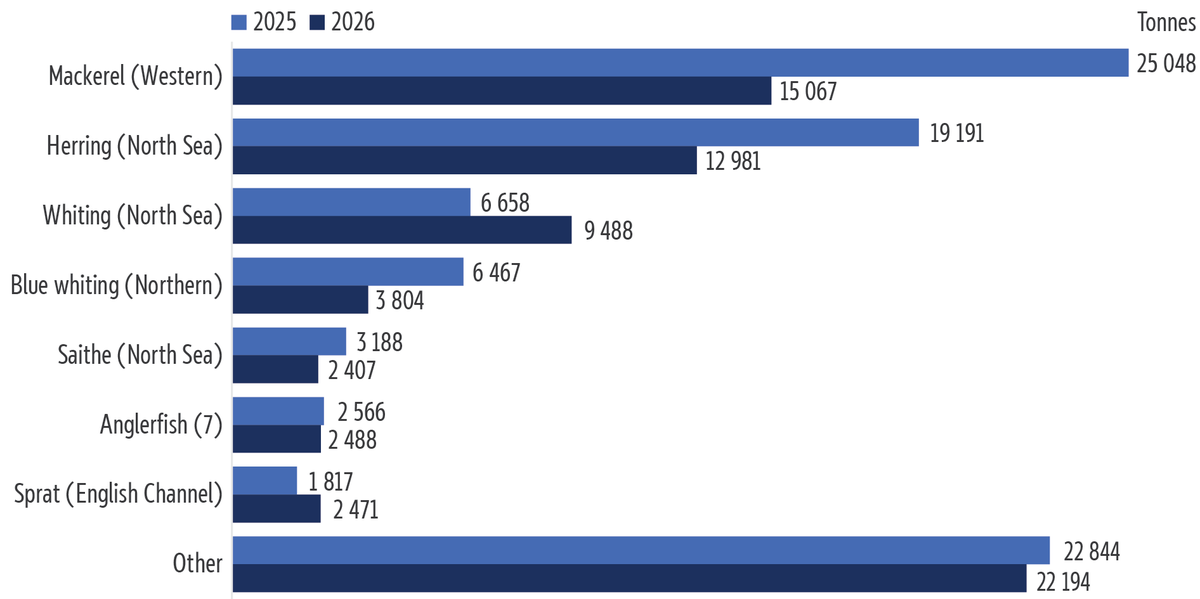
Image source: Data compiled by EPRS, based on information from the TCA, regulations on fishing opportunities and agreed fisheries records with third countries.
In terms of volume, the total loss was almost 88 000 tonnes in 2025 and around 71 000 tonnes in 2026. As Figure 1 illustrates, about half of the volume loss in 2025 came from the pelagic stocks of Western mackerel (29 %) and North Sea herring (22 %). Due to a decline in both stocks, and thus a lower TAC, the two stocks together accounted for around 40 % of the total loss in 2026.
In monetary terms, the total loss was almost €167 million in 2025 and around €149 million in 2026. As Figure 2 shows, the loss in value is more widespread across the stocks than the loss in volume. In 2025, the Western mackerel stock accounted for the highest loss (€31.7 million), but in 2026 , this was surpassed by the demersal North Sea sole stock (€25.8 million). Norway lobster accounted for losses of approximately €16.3 million and €12.9 million in 2025 and in 2026, respectively. Both sole and Norway lobster are high-value stocks due to their high first-sale1 prices.
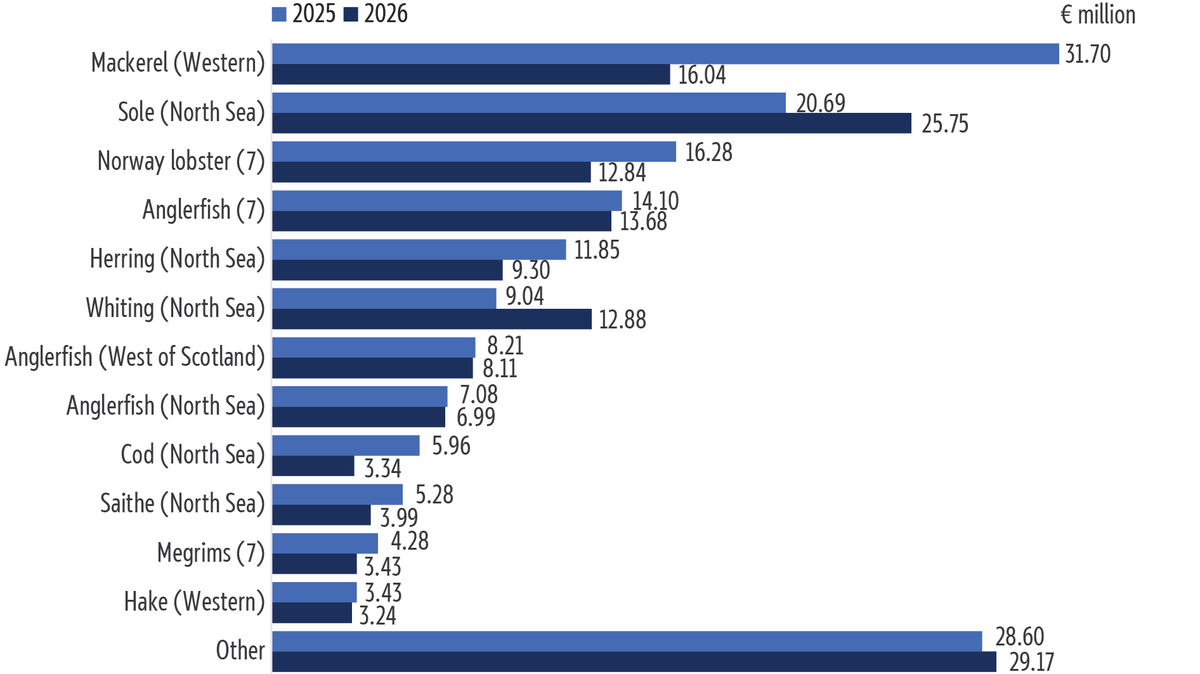
Image source: Data compiled by EPRS, based on information from the TCA, regulations on fishing opportunities, agreed fisheries records with third countries and the 2025 annual economic report on EU fishing fleet.
Figures 3 and 4 show the total loss across all stocks, broken down by Member State and by species for 2025 and in 2026. As Member States have different shares in each stock, they are affected to varying degrees. The seven Member States most affected by Brexit are Belgium, Denmark, Germany, Ireland, France, the Netherlands and Sweden. Together, they account for over 98 % of the total impact in terms of volume and over 99 % in terms of value. The impact of Brexit is also seen, to a much lesser extent, in Estonia, Poland, Portugal, Latvia and Lithuania. The highest impact in terms of volume is for the mackerel and herring pelagic species, while demersal species – anglerfish and sole – account for the highest loss in value in 2026.
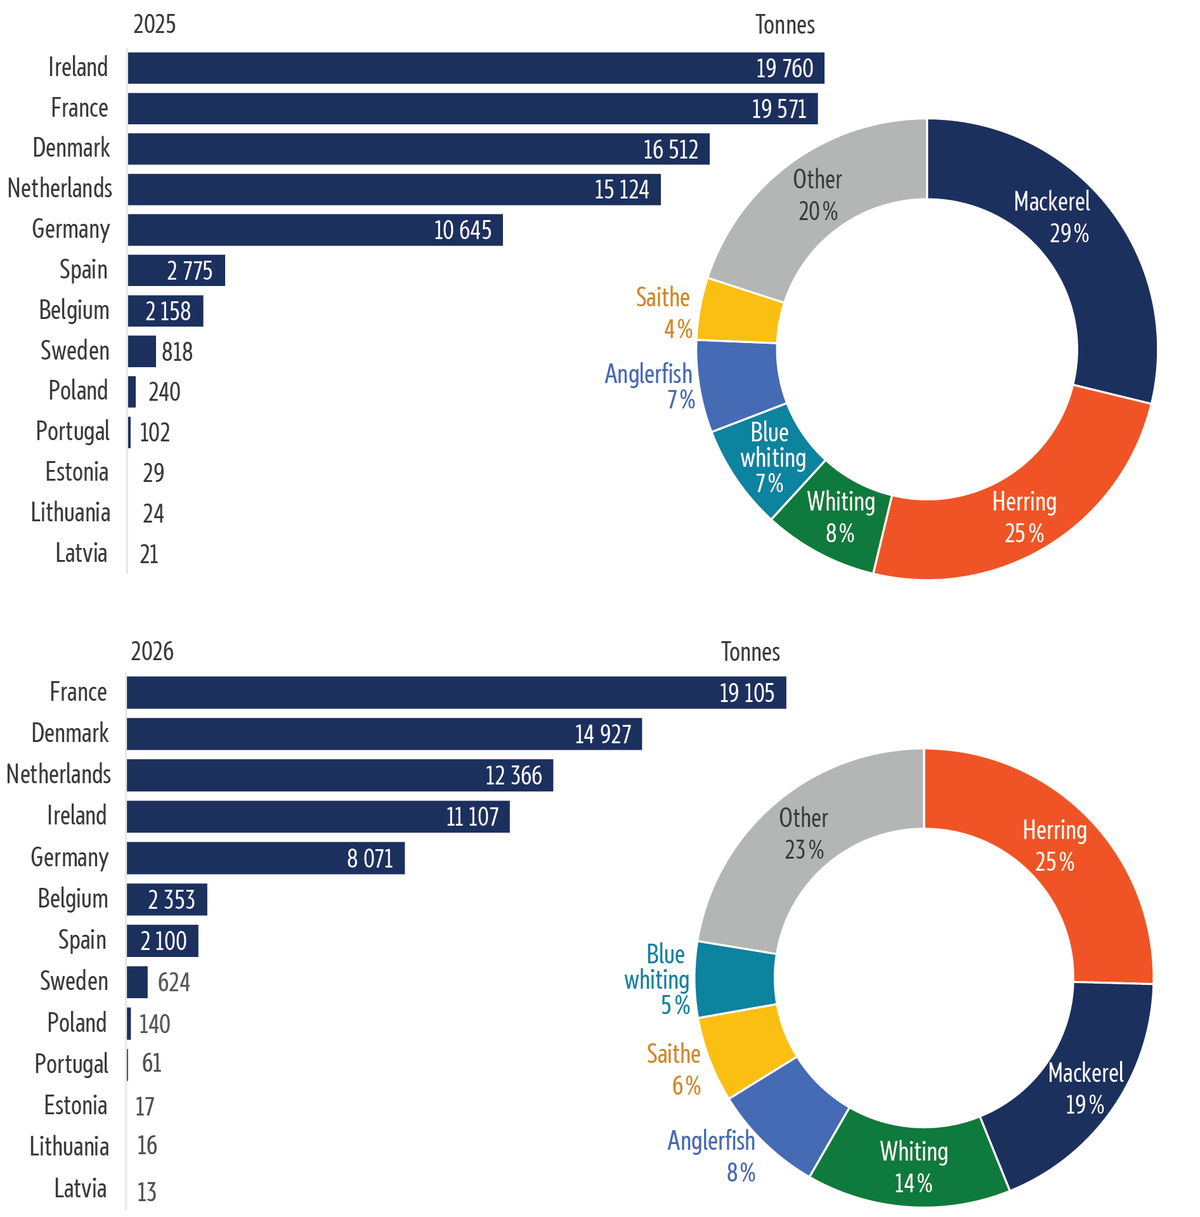
Image source: Data compiled by EPRS, based on information from the TCA, regulations on fishing opportunities and agreed fisheries records with third countries.
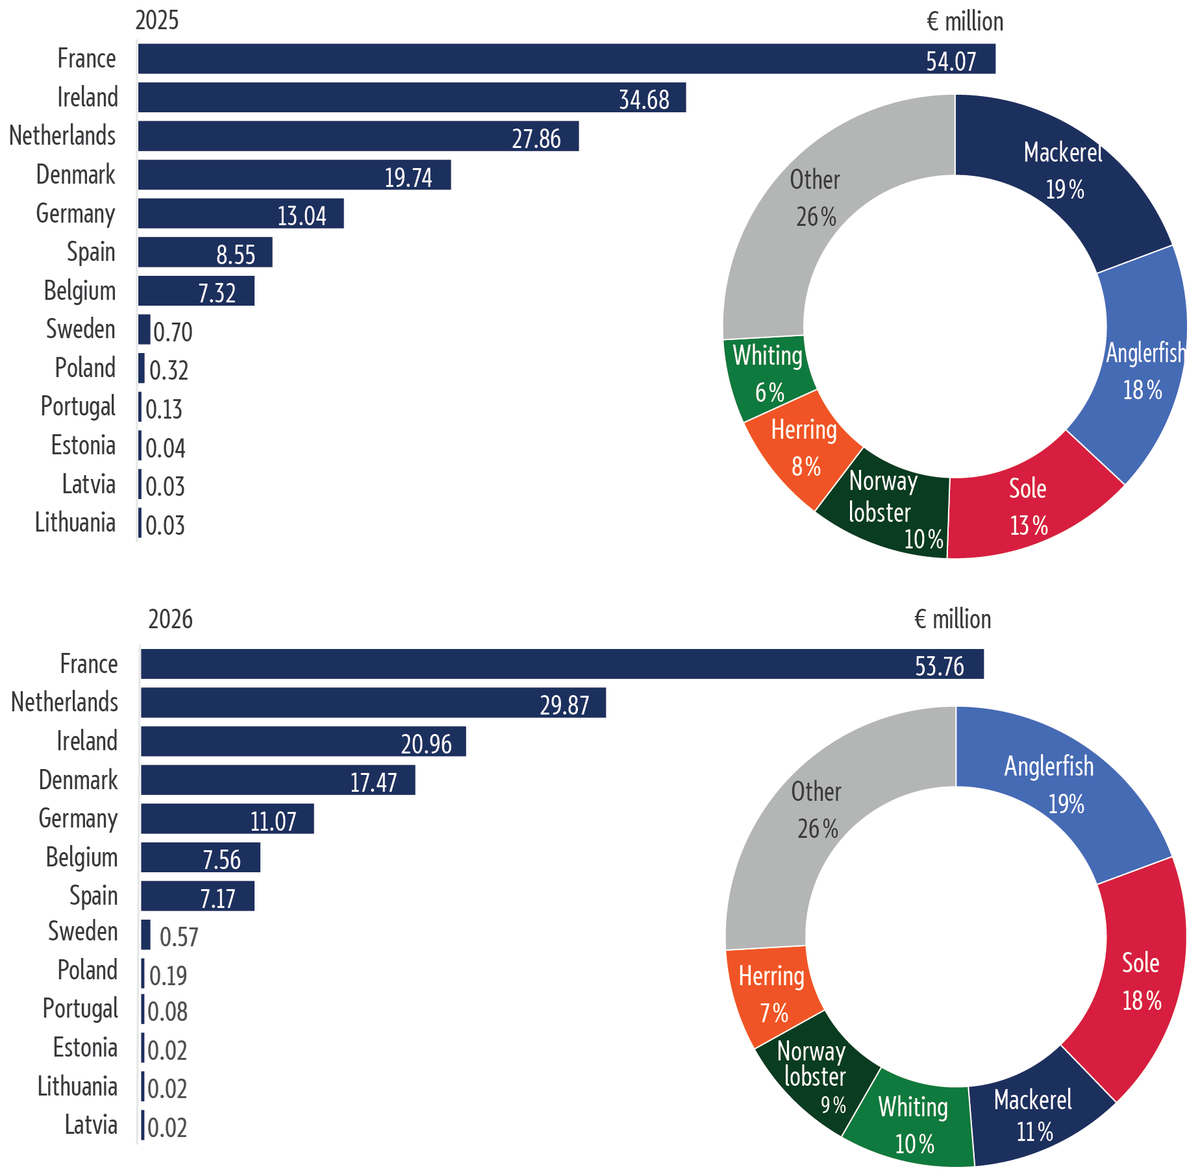
Image source: Data compiled by EPRS, based on information from the TCA, regulations on fishing opportunities, agreed fisheries records with third countries and the 2025 annual economic report on EU fishing fleet.
Figure 5 illustrates the composition of lost quotas for each of the 13 Member States affected. The values shown for each species indicate the total loss of volume and value combined for 2025 and for 2026.
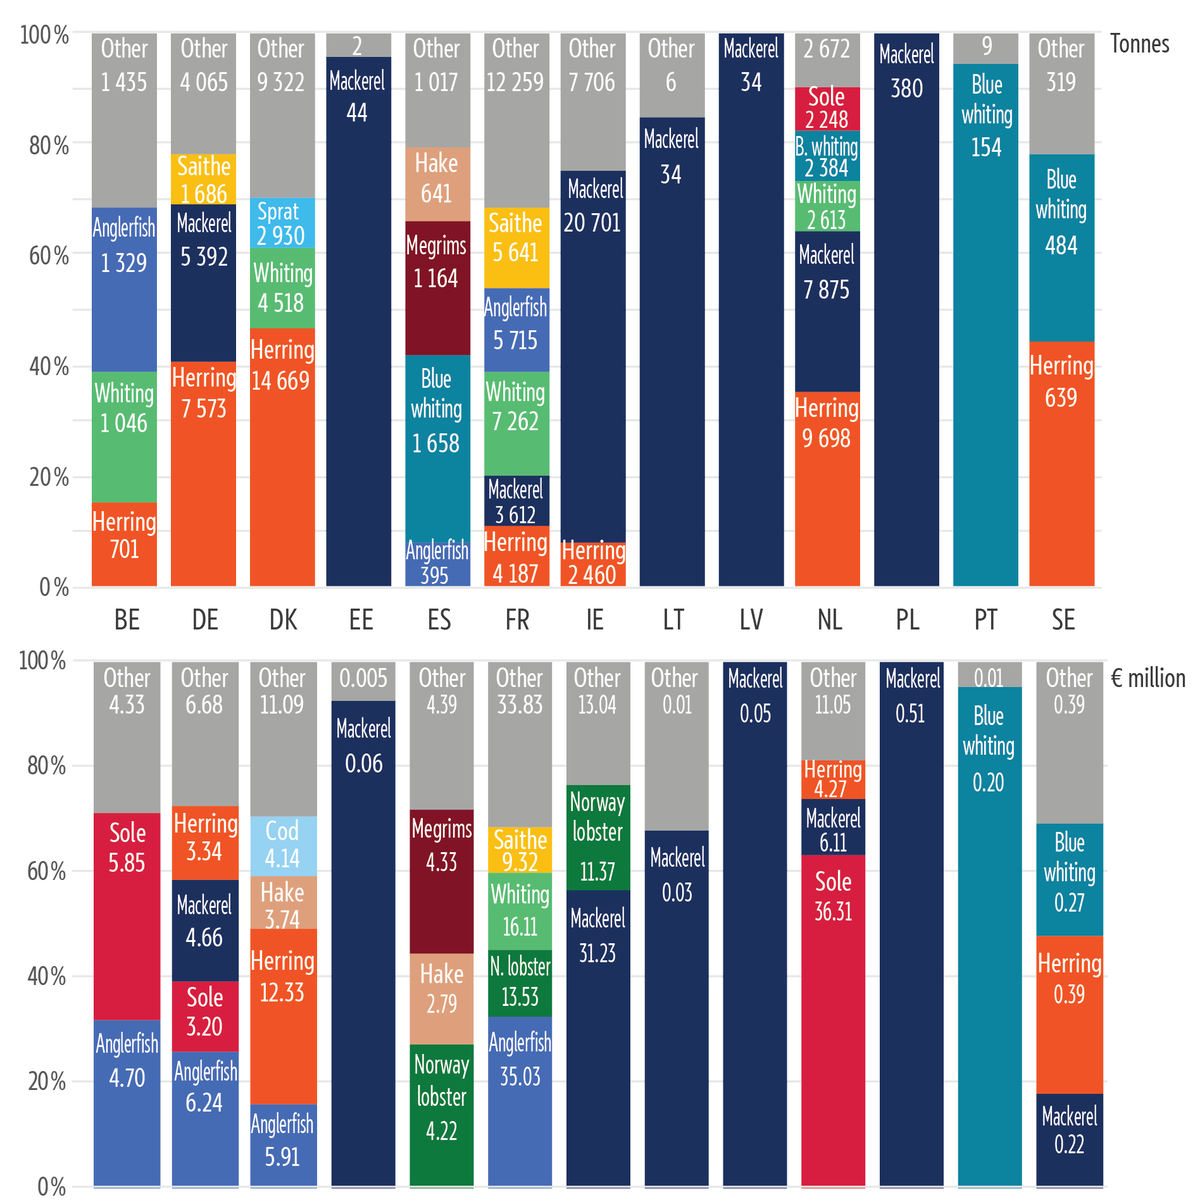
Image source: Data compiled by EPRS, based on information from the TCA, regulations on fishing opportunities and agreed fisheries records with third countries.
The following key observations can be made from the above analysis:
-
France suffers the highest impact overall (especially in terms of value). The loss results from a wide variety of stocks, particularly demersal species. Anglerfish, whiting, Norway lobster and saithe account for around two-thirds of the loss in value.
-
In 2025, Ireland was hit hardest in terms of volume, with the vast majority of its losses stemming from the loss of mackerel quotas. Due to a decline in the western mackerel stock, Ireland's Brexit-related losses are smaller in 2026 compared to 2025. This is because its mackerel losses due to Brexit stem from a reduced quota share of a much lower TAC. For more information on the state of this stock, see 'Special case of north-east Atlantic mackerel'.
-
For Denmark, almost half of the impact in terms of volume comes from the loss of North Sea herring quotas. It should be noted that Denmark was initially, in the first years after Brexit, the hardest-hit in terms of volume, due to the high losses from its Norway pout quotas.2
-
The Netherlands suffered the largest losses of sole catches. However, the Netherlands also accounted for important losses of mackerel and herring in terms of volume.
-
Similar to the Netherlands, Germany accounts for important losses of mackerel and herring in terms of volume, while also accounting for important losses for demersal species, such as anglerfish and sole.
-
For the Belgian fleet, the losses concern predominantly demersal stocks, notably sole, anglerfish and whiting.
-
Spain's loss also comes mainly from demersal fisheries, mostly Norway lobster, megrims and hake (in terms of value), although the blue whiting pelagic species also accounts for a large share of its loss in volume.
-
Sweden lost small volumes of its pelagic quotas for herring, blue whiting and mackerel.
-
Poland, Estonia, Latvia and Lithuania suffered minor losses for mackerel, while Portugal felt minor losses for blue whiting.
Methodology
Total allowable catches vary year-on-year, depending on the stock's biological status. The following method was therefore used to calculate the impact of Brexit. For each of the 55 stocks, a Member State's quotas for 2025 and 2026 are compared with what they would have been if their pre-Brexit quota share had applied.
This has the somewhat paradoxical effect that where the TAC is particularly high in a given year due to favourable biomass levels, the loss in EU quotas due to Brexit is greater. Conversely, if the TAC were to be reduced – for example, due to an unfavourable ecological situation or overfishing – the Brexit loss is smaller. Indeed, a reduced EU share of a smaller TAC implies a lower Brexit impact than an equivalent share of an increased TAC. Nevertheless, it is obvious that an increased TAC is more favourable to the fishers than a reduced TAC. In the latter case, EU fishers are disadvantaged by both Brexit and lower catch levels. This is illustrated below for the western mackerel stock (see 'Western mackerel').
As the TACs and quotas are expressed in terms of weight (tonnes of fish), the impact of Brexit is equally calculated in tonnes. However, the economic value of fish stocks varies from one species to another. The impact of Brexit is therefore also calculated in terms of value, by using the average prices by species. These prices vary per year and per Member State, in line with the local market trends. This briefing uses the data published by the Scientific, Technical and Economic Committee for Fisheries (STECF).3 The prices used in this analysis are for 2023, as this is the most recent year for which nearly complete data is available from all Member States. Consequently, the value impact of Brexit is presented in terms of 2023 prices.4
By way of example, this calculation of the impact of Brexit is illustrated here using the North Sea sole stock. Table 1 shows the relative stability keys before Brexit (the 'old share', namely the 2020 quota shares) and the shares that apply since 2025 (the 'new share'). The 2025 quotas are then recalculated as if the old shares would have applied. The differences between the two 2025 values gives the Brexit loss in tonnes. The same loss is then converted into € million, based on the price information from STECF.
| Country | Old share | New share | STECF price (in €/kg) | 2025 quota | virtual 2025 quota (old share) | Brexit loss in tonnes | Brexit loss in € million |
|---|---|---|---|---|---|---|---|
| Belgium | 8.33 % | 7.22 % | 16.75 | 722 | 833 | 111 | 1.86 |
| Denmark | 3.81 % | 3.30 % | 16.91 | 330 | 381 | 51 | 0.86 |
| Germany | 6.67 % | 5.78 % | 16.09 | 578 | 667 | 89 | 1.43 |
| France | 1.67 % | 1.44 % | 17.46 | 144 | 166 | 22 | 0.38 |
| The Netherlands | 75.24 % | 65.25 % | 16.15 | 6 521 | 7 520 | 999 | 16.14 |
| Total EU | 95.72 % | 83.00 % | 8 295 | 9 567 | 1 272 | 20.68 | |
| UK | 4.28 % | 17.00 % | 1 700 | 428 | |||
| Total EU+UK | 100.00 % | 100.00 % | 9 995 | 9 995 |
Data source: Data compiled by EPRS, based on information from the TCA, regulations on fishing opportunities, agreed fisheries records with third countries and the 2025 annual economic report on EU fishing fleet.
This calculated loss reflects those of the initial EU fishing rights, but not necessarily of the actual loss for a given fleet. For example, it does not take into account subsequent quota exchanges that may take place, such as those between the EU and third countries, or between Member States.5 The level of quota consumption in a given year or year-on-year quota carryovers are also not considered.
Hague preferences
The EU's system of TACs and quotas began in 1983. The choice of the relative stability keys was based on historical catch patterns. However, as Ireland's fishing sector was underdeveloped at that time, establishing fixed keys based on historical catches was not favourable to Ireland. The UK also had concerns, particularly regarding the loss of its cod fishing rights in Icelandic waters and the protection of the fishing rights of its coastal communities. Consequently, a compensation system was established that took these factors into account. This system is known as the Hague preferences, as it was decided during a Council meeting in The Hague. It guaranteed the UK and Ireland a minimum quota of certain stocks in years when the TAC was very low.
However, other Member States do not always view the Hague preferences favourably, as their allocation is reduced as a result of their application. The preferences are not legally binding, but are part of a political negotiation in which Ireland (and the UK at the time) request their application.6 The Council negotiates the acceptance of these 'invocations', typically by seeking a balance between the Member States concerned.
Brexit meant that the UK can no longer benefit from these preferences. For example, the TCA provides for a significant increase in the UK’s fishing quotas for the West of Scotland saithe stock: from a traditional relative stability key (i.e. without Hague preferences) of 17.69 % to 51 % (see Table 2). However, we have to go back more than two decades, to the fishing opportunities for 2004, to see the last time that the share of about 18 % was used for the UK (due to a high TAC level). Since then, the UK and Ireland always had a more favourable share, thanks to the application of Hague preferences. According to a UK analysis, the average pre-Brexit UK share for this stock, including Hague gains, amounted to an average of 41 % for the 2014 to 2020. In 2020, the UK share was 42.37 %. As the UK lost these preferences, Brexit initially resulted in a UK loss for this stock: the UK’s new share as agreed in the TCA for the first year of the transition period (2021) was 37.68 % lower than the share the UK received in the years before Brexit. According to another UK analysis, this was also the case for North Sea haddock, North Sea whiting and West of Scotland whiting. Although the UK ended up with at least the same net share of these stocks after the transition period, the significant increase reflected in the TCA was, in practice, much smaller, given that the UK lost Hague preferences for these stocks. As shown in Table 2, the EU loss is calculated by taking these Hague gains into account.
| Country | Relative stability key (without Hague gains) | 2020 share (including Hague gains for Ireland and the UK) | 2025 share (including Hague gains for Ireland) | STECF price (in €/kg) | 2025 quota | virtual 2025 quota (2020 share) | Brexit loss in tonnes | Brexit loss in € million |
|---|---|---|---|---|---|---|---|---|
| Germany | 7.31 % | 4.77 % | 4.04 % | 1.62 | 300 | 354 | 54 | 0.09 |
| Ireland | 2.42 % | 5.46 % | 4.92 % | 1.44 | 366 | 406 | 40 | 0.06 |
| France | 72.57 % | 47.40 % | 40.04 % | 1.65 | 2 976 | 3 523 | 547 | 0.90 |
| Total EU | 82.31 % | 57.63 % | 49.00 % | 3 642 | 4 284 | 641 | 1.05 | |
| UK | 17.69 % | 42.37 % | 51.00 % | 3 791 | 3 149 | |||
| Total EU+UK | 100.00 % | 100.00 % | 100.00 % | 7 433 | 7 433 |
Data source: Data compiled by EPRS, based on information from the TCA, regulations on fishing opportunities, agreed fisheries records with third countries and the 2025 annual economic report on EU fishing fleet.
Situations that differed from the examples mentioned above required another approach. For example, only Ireland could invoke Hague preferences for Celtic Sea haddock, which were applied in 2025 but not in 2020. To make a meaningful calculation of the impact of Brexit, we first apply the same Hague gain to the old (2020) share.
For 2026, no Hague preferences were granted to Ireland.7 This especially concerns mackerel stock, which is overfished and at a historical low level, as well as herring and a number of whitefish stocks.8 For the stocks where Ireland was denied the Hague preferences for 2026 (but not in 2020 and 2025), we compare the 2026 values with values calculated as if the old relative stability keys would have applied.
In some cases, where the EU's relative stability among Member States changed due to changes in the management area of the stock, the new share was first re-calculated according to the former system, to allow a straightforward comparison with the pre-Brexit share. This was notably the case for North Sea mackerel.9
Special case of north-east Atlantic mackerel
North-east Atlantic mackerel is a widely distributed species historically fished by Norway, the UK, the Faroe Islands, EU Member States and the Russian Federation. The latter is not considered a 'coastal state' for this stock, as it does not occur in significant numbers within its waters.10 Since 2006, Iceland and Greenland have entered the fishery as the stock migrated north-westwards into their waters. This current six coastal parties for north-east Atlantic Mackerel are therefore the EU, the UK, Norway, the Faroe Islands, Iceland and Greenland.
Between 2014 and 2020, a mackerel-sharing agreement was in place between the EU, Norway and the Faroe Islands. Iceland, Greenland and the Russian Federation were not parties to this agreement, although it set aside a reserve quota (15.6 % of the TAC) for new signatories. Figure 6 shows the related 2020 quota shares, with separate values for the EU27 and the UK. As can be seen, due to the lack of a comprehensive sharing agreement, the total of the quotas set by all parties was 21.5 % above the TAC.
Following the UK's withdrawal from the EU, the EU agreed to transfer a portion of its mackerel quota to the UK. While there is only one single TAC for North-East Atlantic mackerel, the related EU quotas are divided across different fishing opportunities tables in the EU's regulations, two of which included an allocation for the UK: Western mackerel and North Sea mackerel. While the respective EU/UK ratio for North Sea mackerel changed only slightly, there was a more substantial change in quota shares for the Western mackerel stock. Although the EU and the UK agreed on their respective shares vis-à-vis each other, the existing sharing agreement broke down due to unilateral actions by the other two parties: Norway and the Faroe Islands, who increased their quota shares for 2021 unilaterally (see Figure 6).
On 17 June 2024, the UK, Norway and the Faroe Islands signed a trilateral agreement for 2024, 2025 and 2026, with the following TAC quota shares: Norway (31 %), the Faroe Islands (13.35 %) and the UK (27.48 % for 2024 and 27.83 % for 2025 and 2026). The three parties invited other parties to join the agreement, but as the remaining portion did not reflect the historic shares, the EU dismissed the agreement. The six coastal parties initially continued to agree on the TAC (which was also in line with the scientific recommendation), but did not agree on a new comprehensive quota sharing arrangement.
On 16 December 2025, the UK, Norway, the Faroe Islands and Iceland reached a four-party quota-sharing arrangement. This marked the first time Iceland became a signatory to a mackerel-sharing agreement. The quota allocation (after taking into account the EU/UK shift, and before further bilateral quota transfers between the parties) are as follows: Norway (28.24 %), the UK (27.83 %), the Faroe Islands (13.35 %) and Iceland (12.50 %). In reaction, the EU expressed deep concern about the four-party agreement, which was concluded without prior consultation with the EU.
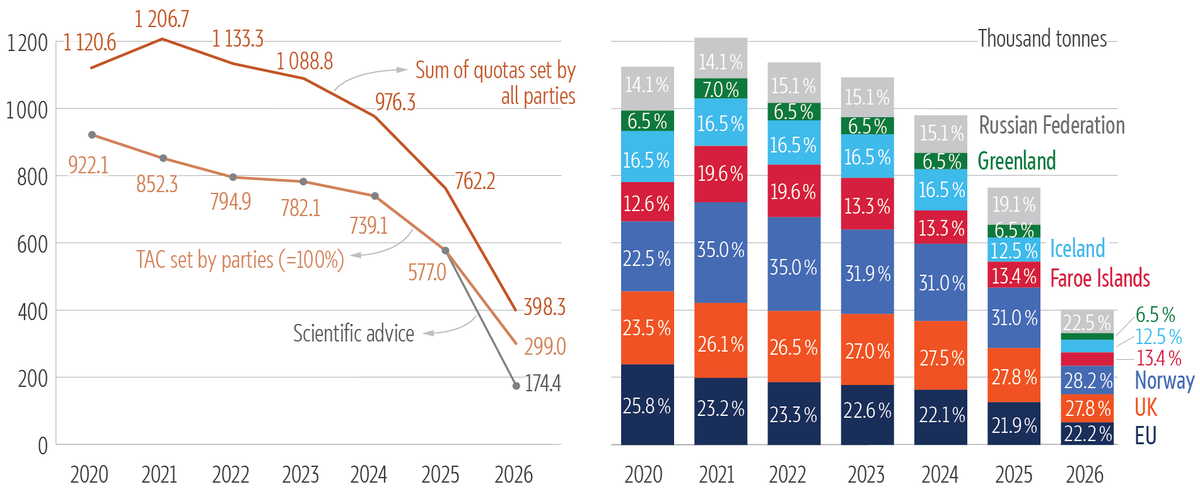
Image source: Data compiled by EPRS, based on information from the TCA, regulations on fishing opportunities, agreed fisheries records with third countries, the three-party and four-party quota sharing agreement, and latest information from Norway, the UK, Greenland and the Russian Federation.
The stock's biological state is declining because the sum of all quotas consistently exceeds the TAC. Consequently, the TAC decreases year-on-year. In addition, for 2026, the parties to the 'four-party agreement' chose a TAC of 299 010 tonnes, which is 72 % higher than the scientific advice.11 The EU initially set its quota in line with the best available scientific advice (i.e. the TAC of 174 357 tonnes). However, in the absence of an agreement with the other coastal states, the EU aligned with the higher TAC. Equally, Greenland aligned with this TAC. Regarding the Russian quotas, the European Commission noted that 'since Russia's annual catch in past years exceeded 100 000 tonnes, with this arrangement the overall fishing pressure on the stock in 2026 is expected to surpass 400 000 tonnes, far above the recommended level'.12
Western mackerel
Western mackerel is the main stock of North-East Atlantic mackerel.13 Due to the decline of mackerel, for the first time ever, Hague preferences were invoked and granted to Ireland for this stock for 2025. However, as mentioned above, they were denied to Ireland for 2026.
The total EU Brexit loss amounts to about 25 000 tonnes for 2025 and 13 000 tonnes in 2026. But these losses come on top of the reduced catch limits due to the decline of the stock. As Table 3 shows, the EU quotas dropped from 153 000 tonnes in 2020 to less than 37 000 tonnes in 2026, as a result of the combination of a lower TAC level and a reduced TCA share.
| Country | 2020 quota | 2025 quota | 2025 share | 2026 quota | 2026 share | 2025 Brexit loss in tonnes | 2026 Brexit loss in tonnes |
|---|---|---|---|---|---|---|---|
| Germany | 23 416 | 9 640 | 4.19 % | 5 612 | 4.70 % | 5 012 | 1 918 |
| Spain | 25 | 10 | 0.00 % | 6 | 0.01 % | 6 | 2 |
| Estonia | 195 | 80 | 0.03 % | 47 | 0.04 % | 42 | 16 |
| France | 15 612 | 6 428 | 2.79 % | 3 742 | 3.14 % | 3 341 | 1 321 |
| Ireland | 78 052 | 39 914 | 17.33 % | 18 705 | 15.67 % | 8 925 | 6 606 |
| Latvia | 144 | 59 | 0.03 % | 34 | 0.03 % | 31 | 13 |
| Lithuania | 144 | 59 | 0.03 % | 34 | 0.03 % | 31 | 13 |
| Netherlands | 34 147 | 14 059 | 6.11 % | 8 184 | 6.86 % | 7 307 | 2 889 |
| Poland | 1 649 | 679 | 0.29 % | 395 | 0.33 % | 353 | 140 |
| Total EU | 153 384 | 70 928 | 30.80 % | 36 759 | 30.80 % | 25 048 | 12 981 |
| UK | 214 647 | 159 356 | 69.20 % | 82 587 | 69.20 % | ||
| Total EU+UK | 368 031 | 230 284 | 100.00 % | 119 346 | 100.00 % |
Data source: Data compiled by EPRS, based on information from the TCA, regulations on fishing opportunities and agreed fisheries records with third countries.
While the decline in mackerel stocks is not directly related to Brexit, it is evident that unstable fisheries relations in the North-East Atlantic have aggravated the situation. The EU is aiming for a constructive solution, including all coastal parties.
Main references
- Scholaert, F. and Popescu, I., Brexit and the reduction in EU fishing quota shares, 2021 to 2023, EPRS, European Parliament, 2022.
- Scholaert, F. and Popescu, I., EU-UK relations in fisheries, EPRS, European Parliament, 2021.
Endnotes
Classification
Policy areas: Fisheries
Regions: European Union, Non-EU Europe and the North
Committees: Fisheries (PECH)
Disclaimer
This document is prepared for, and addressed to, the Members and staff of the European Parliament as background material to assist them in their parliamentary work. The content of the document is the sole responsibility of its author(s) and any opinions expressed herein should not be taken to represent an official position of the Parliament.
Copyright
© European Union.
The reuse of this document is authorised under a Creative Commons Attribution 4.0 International (CC-BY 4.0) licence.

https://creativecommons.org/licenses/by/4.0/deed.en
To use or reproduce elements that are not owned by the European Union, permission may need to be sought directly from the respective rightsholders.